
At Dains Accountants, diversity is more than a commitment—it's a driving force behind our innovation and success. We believe in creating a workplace that reflects the rich diversity of the communities we serve. Our latest diversity statistics highlight our ongoing efforts to foster an inclusive environment where every individual is respected and valued. We are proud to share these insights as part of our dedication to continuous improvement and transparency.
Diversity at Dains Report July 2024
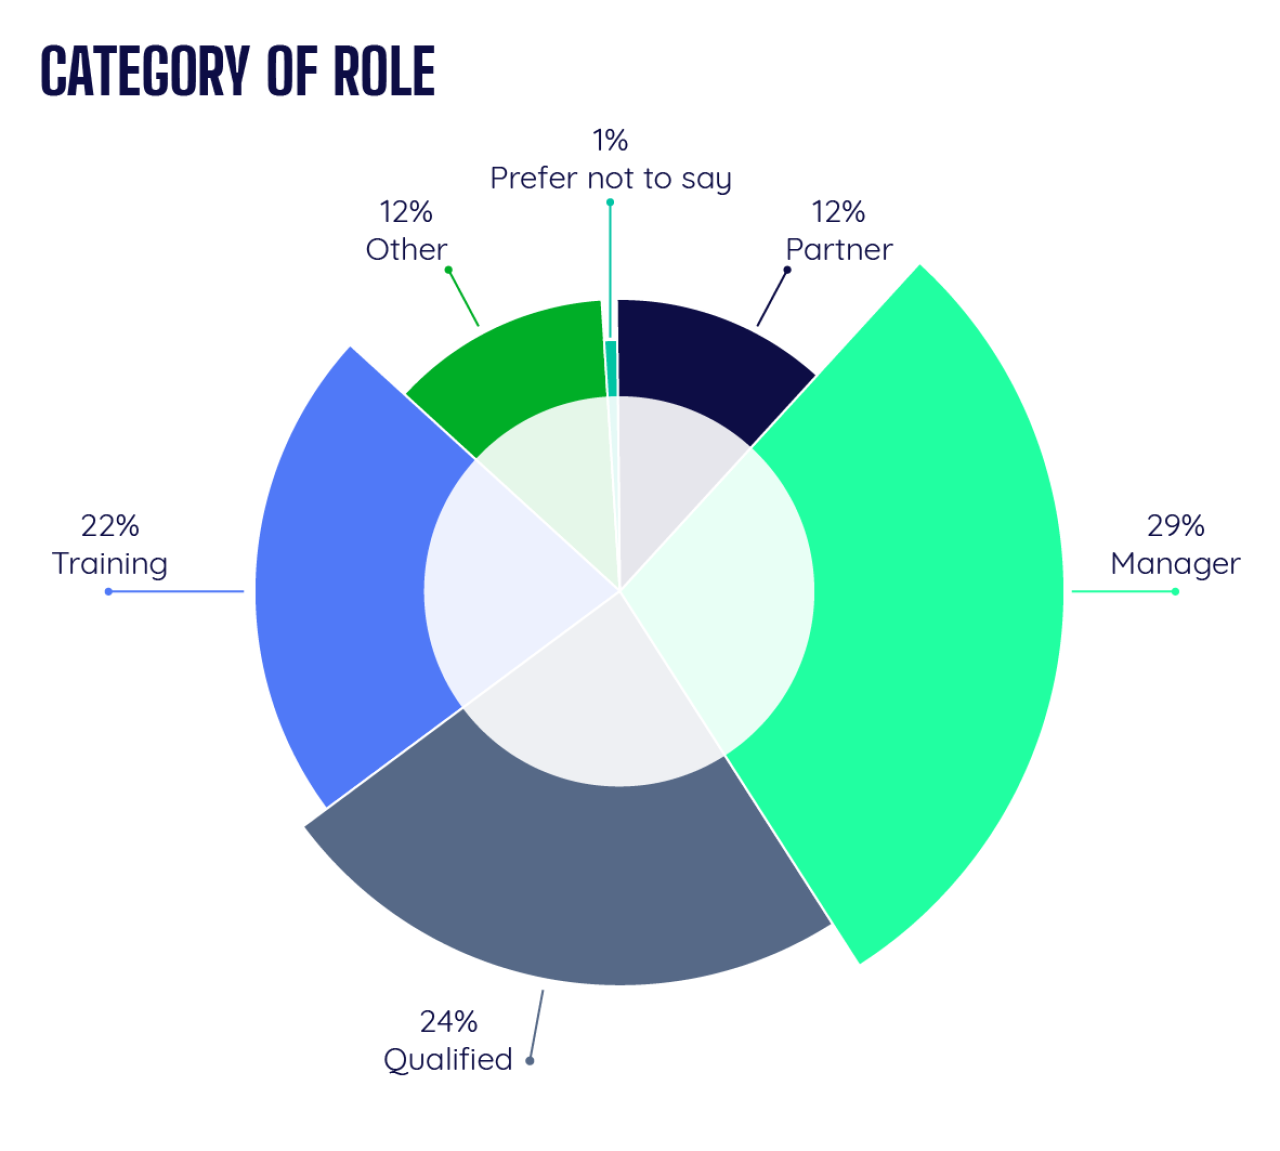
Category of Role July 2024
This chart represents the distribution of roles within Dains Accountants. The majority of employees (29%) are in managerial roles, followed by 24% in qualified positions, 22% in training roles, and 12% as partners. Additionally, 12% are in other roles, with 1% preferring not to disclose their role category.
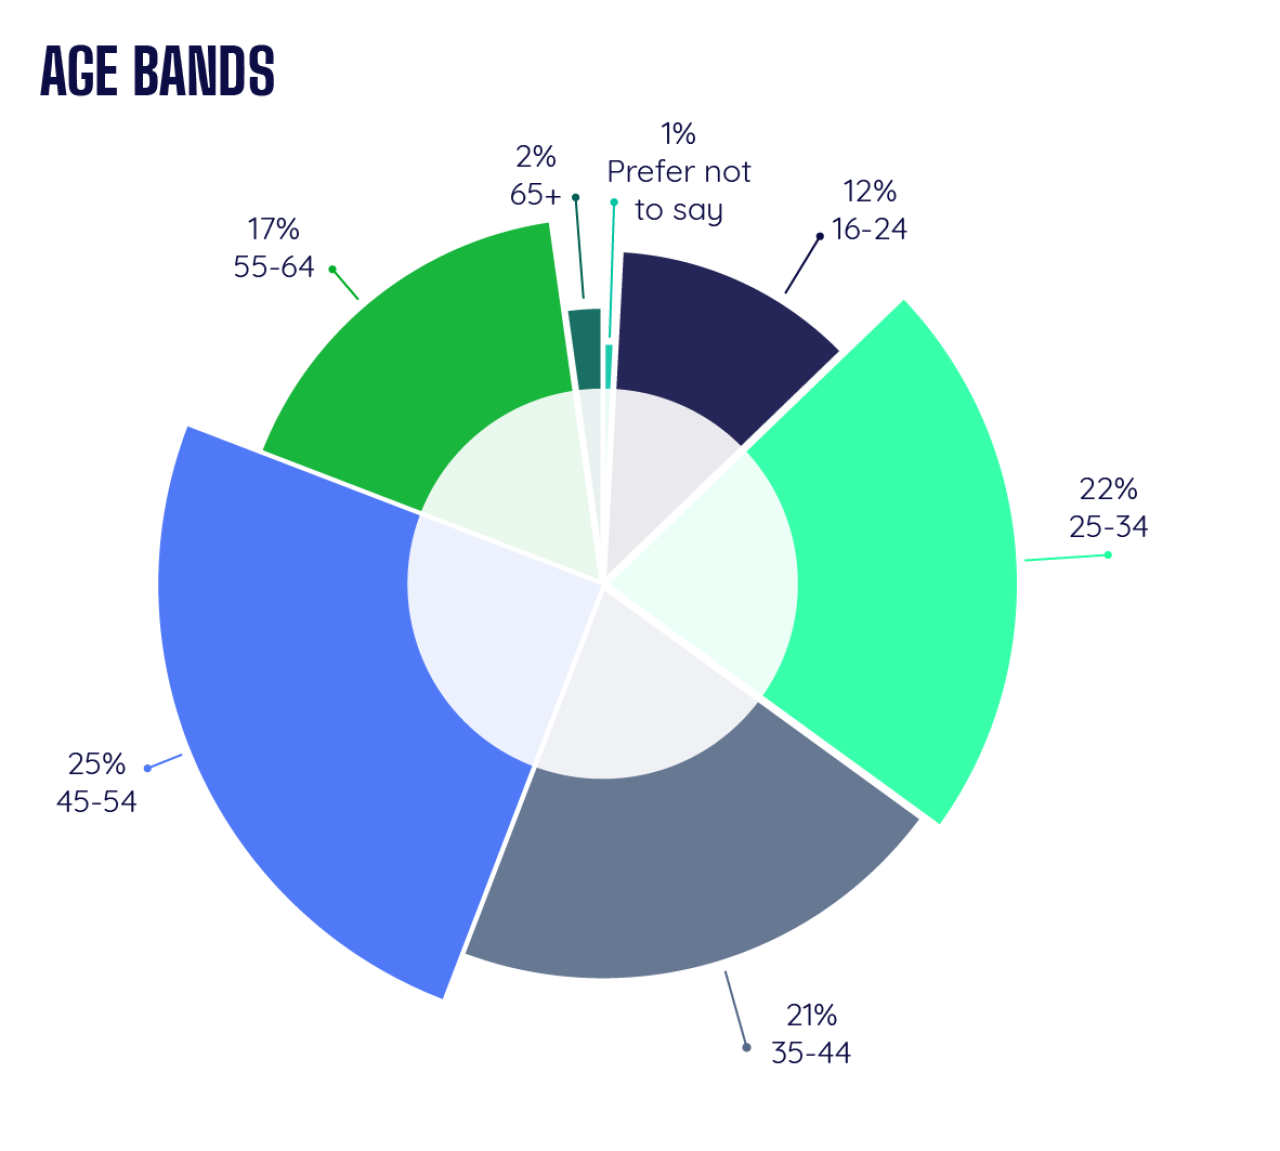
Age Bands - July 2024
The age distribution of Dains Accountants' employees shows a broad range. The largest groups are those aged 45-54 (25%) and 25-34 (22%), followed by 35-44 (21%), and 55-64 (17%). The youngest group, 16-24, makes up 12%, while the oldest group, 65+, accounts for 2%. Only 1% of respondents preferred not to disclose their age.
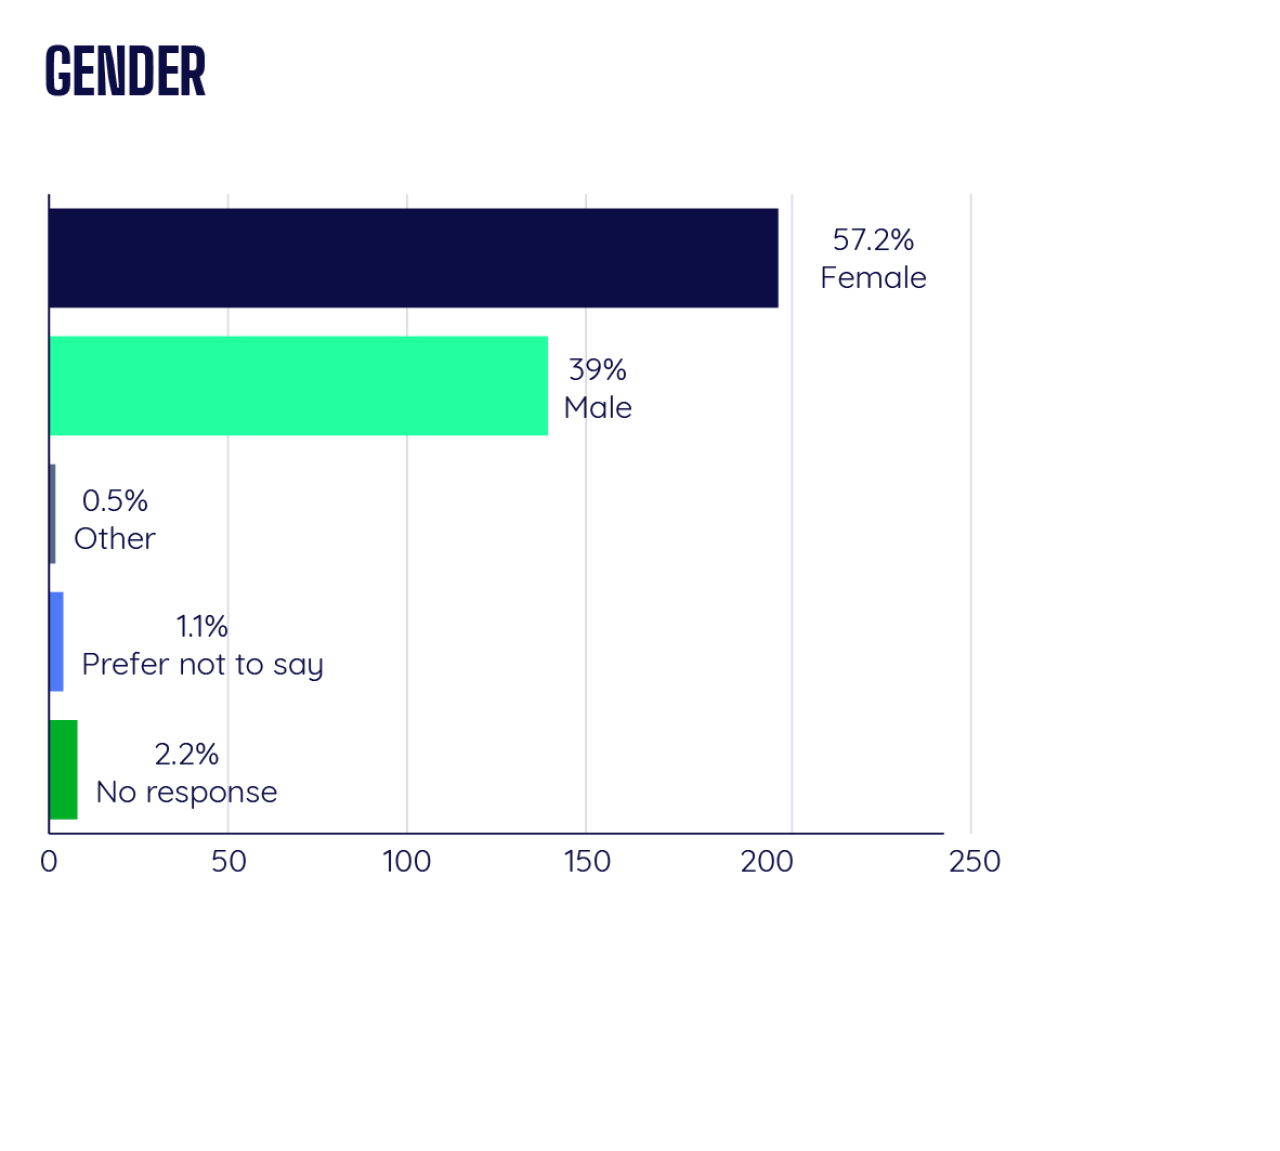
Gender Split - July 2024
The gender distribution at Dains Accountants is predominantly female, with 57.2% identifying as female and 39% as male. A small percentage identify as other genders (0.5%), prefer not to disclose (1.1%), or did not respond (2.2%).
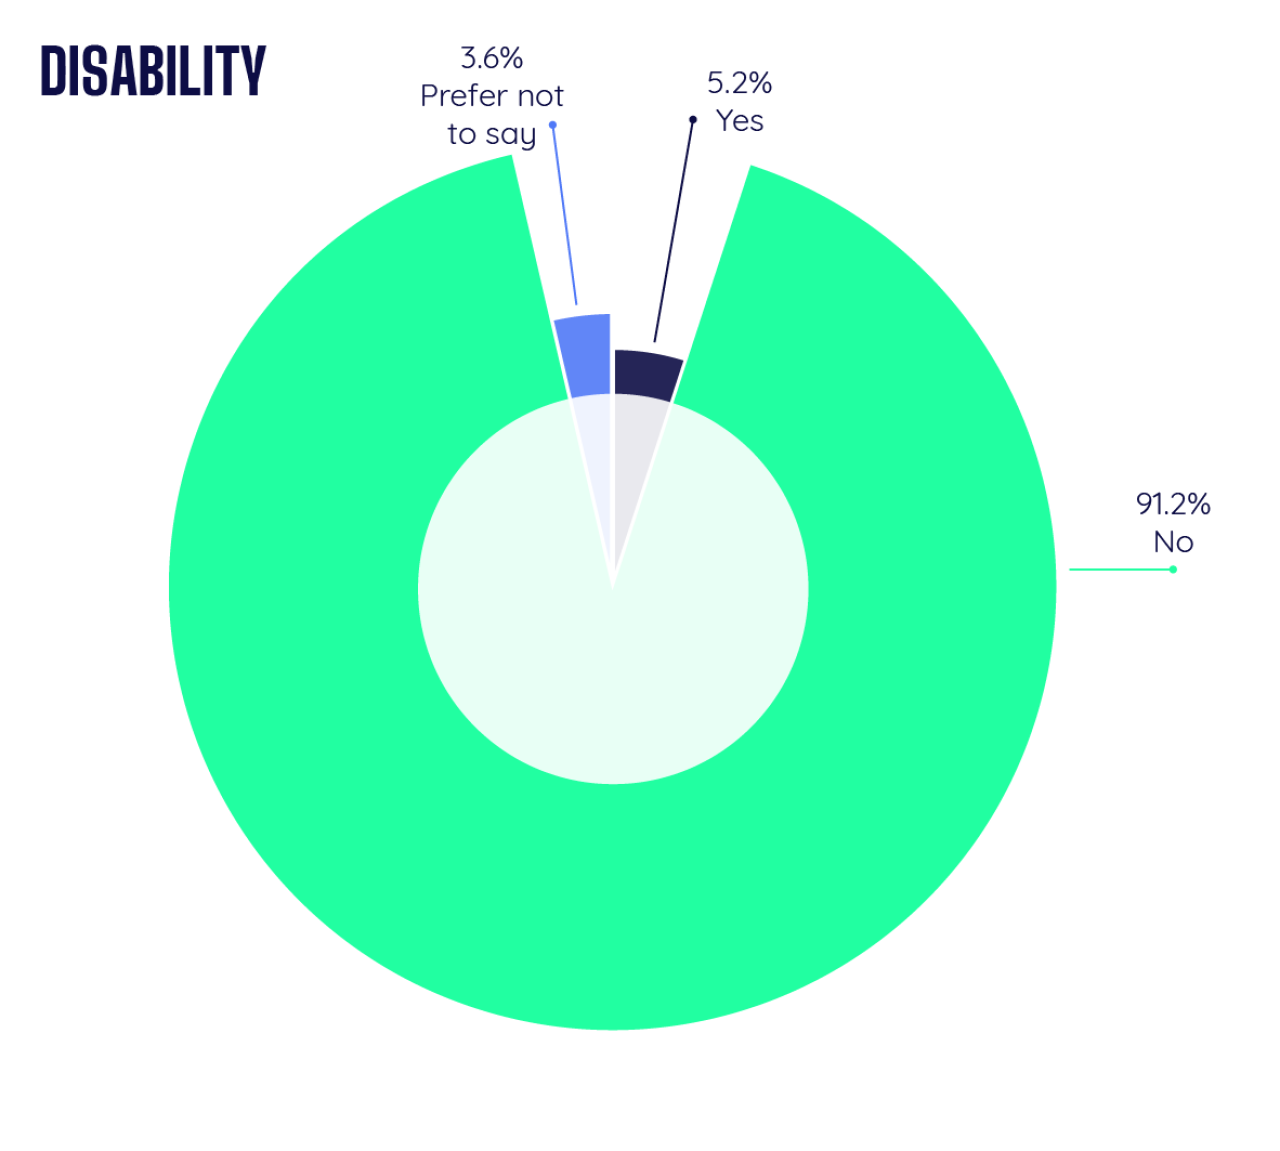
Disability - July 2024
The vast majority (91.2%) of Dains Accountants' employees do not identify as having a disability. A smaller portion (5.2%) does identify as having a disability, while 3.6% prefer not to say.
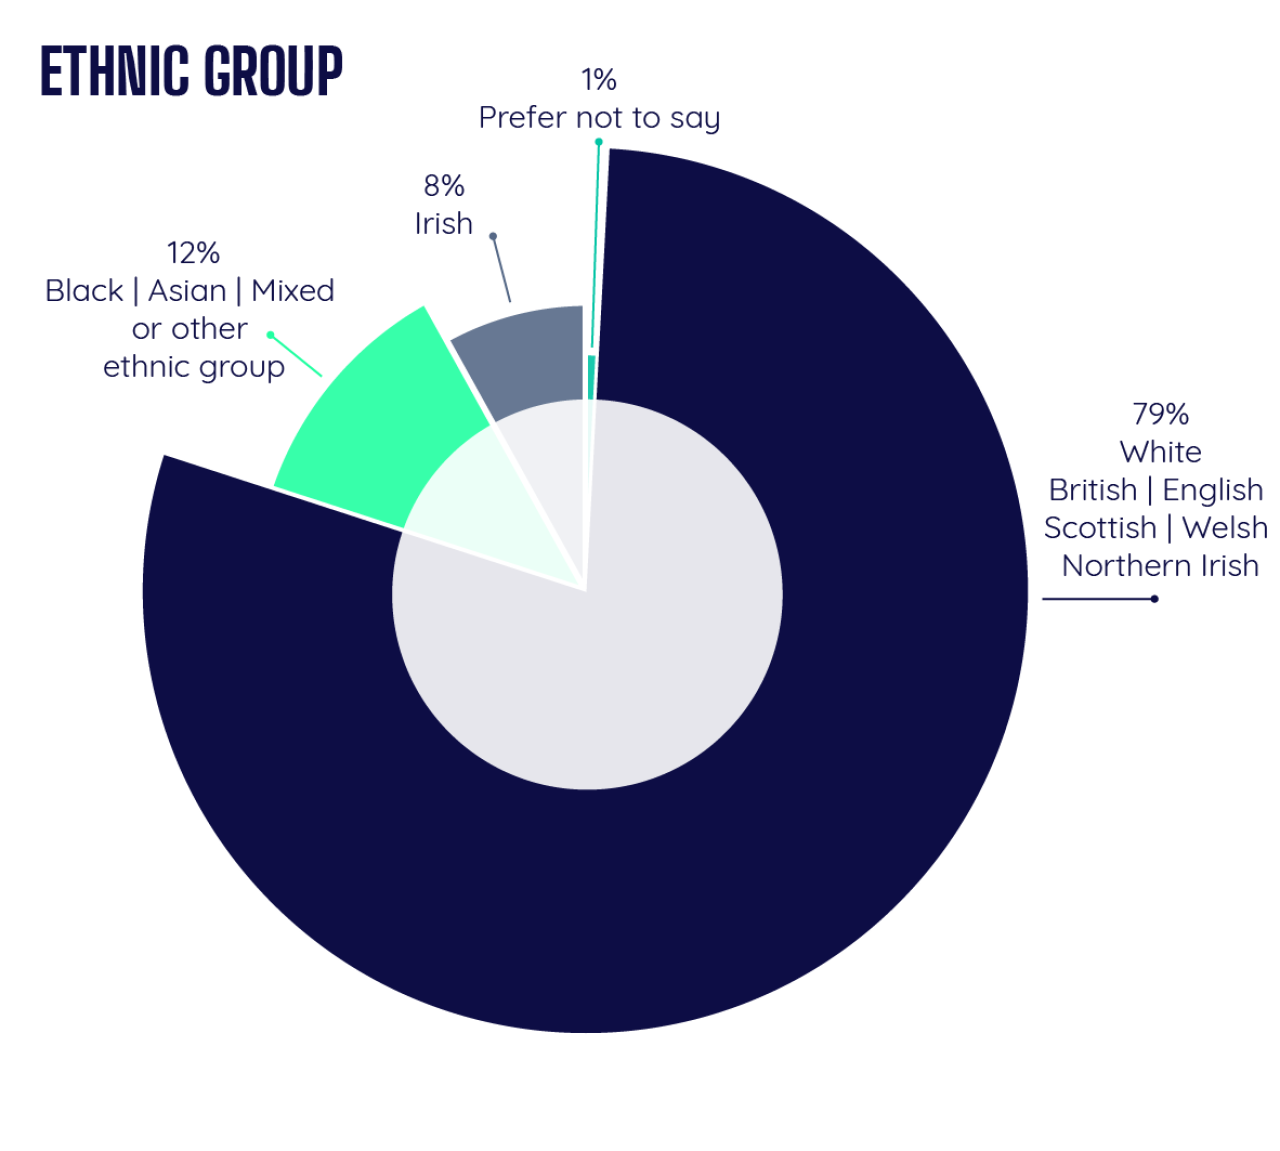
Ethnic Groups - July 2024
The ethnic diversity within Dains Accountants shows that 79% of employees identify as White British/English/Scottish/Welsh/Northern Irish. Other ethnic groups include Black, Asian, Mixed, or other ethnic groups (12%), and Irish (8%). A small number (1%) prefer not to disclose their ethnic background.
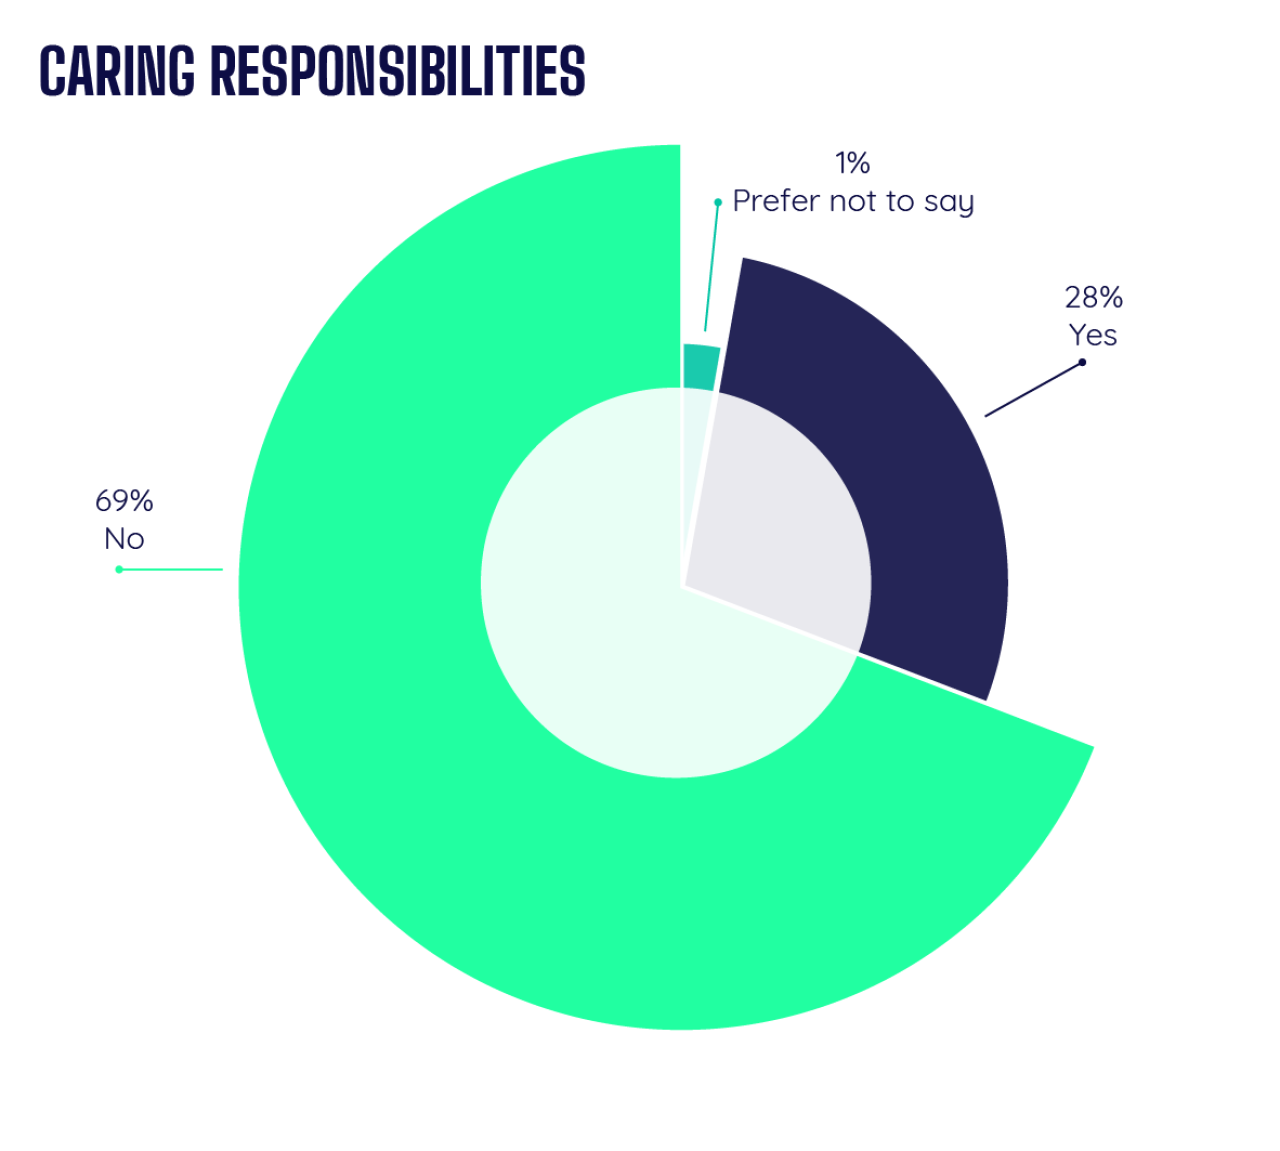
Caring Responsibilities - July 2024
This chart reveals that 69% of Dains Accountants' employees do not have caring responsibilities, while 28% do. A small percentage (1%) preferred not to disclose whether they have caring responsibilities.

Get in touch
If you have any questions about our diversity statistics or initiatives at Dains Accountants, please don't hesitate to reach out. Our commitment to fostering an inclusive and diverse workplace is at the heart of what we do, and we are always here to provide further insights or discuss how we can continue to improve. Contact us today to learn more.